Mcap qPCR Trials
qPCR of Master’s Thesis Mcap Color Morphs and Subsequent Troubleshooting
Resuspension Completed on 20191003
Goal here is to make stock suspensions for the qPCR C and D Actin Primers and Probes - Run DNA through Qubit to make sure have enough
IDTDNA Resuspension Instructions
1)Centrifuge lyopholized primers for 2 mins at 12,000 RCF
2) Add TE Buffer (modulated pH unlike H2O)
	- Recommended to be no less than 1uM and no greater than 10mM
	- Standard is 100uM

		-25nmol ordered = 250uL of TE gets you to 100uM
			- Used Low TE -> 0.1mM EDTA vs 1 mM of EDTA in stock TE Buffer
0.5uL of Forward Primers 100uM required in 1000uL diluted aliquots to get 50nM
- 999.5uL of Ultra Pure H2O
- 0.5uL of 100uM Forward Primers
0.75uL of Reverse Primers 100uM required in 1000uL diluted aliquots to get 75nM
- 999.25uL of Ultra Pure H2O
- 0.75uL of 100uM Forward Primers
1uL of Forward Primers 100uM required in 1000uL diluted aliquots to get 50nM
- 999uL of Ultra Pure H2O
- 1 uL of 100uM Forward Primers
| Primer Id | Resuspended Stock Concentration | Aliquot Concentration | # of Aliquots |
|---|---|---|---|
| C_ACT_For | 100uM | 50nM | 4 |
| C_ACT_Rev | 100uM | 75nM | 4 |
| D_ACT_For | 100uM | 50nM | 4 |
| D_ACT_Rev | 100uM | 75nM | 4 |
| C_ACT_TAQ-Probe | 100uM | 100nM | 1 |
| D_ACT_TAQ-Probe | 100uM | 100nM | 1 |
Summary Table of Nanodrop DNA Results from Hawaii after re-extractions
| Sample Date | Date of Re-extraction | Sample Id | Timepoint | Concentration(ng/uL) | 260/280 | 260/230 |
|---|---|---|---|---|---|---|
| 6/9/2017 | 6/21/2019 | B1 | 0 | 140.4 | 2.03 | 1.43 |
| 6/9/2017 | 6/21/2019 | B2 | 0 | 80.6 | 2.05 | 1.31 |
| 6/9/2017 | 6/21/2019 | B3 | 0 | 73 | 2.09 | 1.21 |
| 6/9/2017 | 6/21/2019 | B4 | 0 | 63.9 | 2.08 | 1.08 |
| 6/9/2017 | 6/21/2019 | B5 | 0 | 77.1 | 2.09 | 1.34 |
| 6/9/2017 | 6/21/2019 | B6 | 0 | 103.1 | 2.05 | 1.3 |
| 6/9/2017 | 6/21/2019 | O7 | 0 | 75.1 | 2.05 | 1.14 |
| 6/9/2017 | 6/21/2019 | O8 | 0 | 80.5 | 2 | 1.15 |
| 6/9/2017 | 6/21/2019 | O9 | 0 | 71.4 | 1.95 | 1.03 |
| 6/9/2017 | 6/21/2019 | O10 | 0 | 54.1 | 2.05 | 1 |
| 6/9/2017 | 6/21/2019 | O11 | 0 | 117.3 | 2 | 1.33 |
| 6/9/2017 | 6/21/2019 | O12 | 0 | 90.1 | 2.05 | 1.25 |
| 6/9/2017 | 6/21/2019 | O13 | 0 | 73.8 | 1.95 | 1.1 |
Summary Table of BR DNA Qubit Results - Completed on 20191003
| Sample Id | Sample Type | Concentration 1 (ng/uL) | Concentration 2 (ng/uL) | Avg Concentration (ng/uL) |
|---|---|---|---|---|
| Standard1 | Standard | 165.99 | NA | NA |
| Standard2 | Standard | 23,383.96 | NA | NA |
| B1_t=0 | Brown Color Morph | 6.14 | 6.00 | 6.07 |
| B2_t=0 | Brown Color Morph | Too_Low | Too_Low | Too_Low |
| B3_t=0 | Brown Color Morph | Too_Low | Too_Low | Too_Low |
| B4_t=0 | Brown Color Morph | 3.54 | 3.50 | 3.52 |
| B5_t=0 | Brown Color Morph | 3.54 | 3.50 | 3.52 |
| B6_t=0 | Brown Color Morph | 4.90 | 4.84 | 4.87 |
| O7_t=0 | Orange Color Morph | Too_Low | Too_Low | Too_Low |
| O8_t=0 | Orange Color Morph | 2.30 | 2.26 | 2.28 |
| O9_t=0 | Orange Color Morph | 3.32 | 3.24 | 3.28 |
| O10_t=0 | Orange Color Morph | 2.06 | 2.04 | 2.05 |
| O11_t=0 | Orange Color Morph | 10.8 | 10.6 | 10.7 |
| O12_t=0 | Orange Color Morph | 2.86 | 2.82 | 2.84 |
| O13_t=0 | Orange Color Morph | 14.9 | 14.7 | 14.8 |
qPCR _Plate _Test Run on 20191007, Results with Janet and Gel on 20191008
Samples Run Today: (All run in triplicate - 24 wells today used; A1-B12)
| **Sample ID | Wells in Plate** |
|---|---|
| Control (Water Input) | A1-A3 |
| Extraction Control (TE Buffer Input) | A4-A6 |
| B1_t=0 | A7-A9 |
| B5_t=0 | A10-A12 |
| B6_t=0 | B1-B3 |
| O9_t=0 | B4-B6 |
| O11_t=0 | B7-B9 |
| O13_t=0 | B10-B12 |
Each Well received (20uL reactions)
-TaqMan® Genotyping Master Mix			10uL
-SymC_For Primer (50nM)				1uL
-SymC_Rev Primer (75nM)				1uL
-SymD_For Primer (50nM)				1uL
-SymD_Rev Primer (75nM)				1uL
-SymC_For Probe (100nM)				1uL
-SymD_Rev Probe (100nM)				1uL
-Ultra Pure Water				2uL (All primers, probes, water, and MM made into Mastermix - multiplied each by 24.2; additional 0.2 for pipette error)

-DNA/Water/TE Buffer 				1uL
qPCR Machine Operation
1) Open Program on qPCR computer (it is in the middle of the desktop - forgot what it is called)
2) Log-in - Username: Putnam Lab - Roche480
3) Open Template - Created a template called “SymC_D_Multiplex” - This template is created from Ross Cunning’s 2016 Excess Algal Symbiont Paper (MEPS Paper) a) Pre Incubation - 50C for 2 mins - 95C for 10 mins b) PCR - 45 Cycles of (Ross’s was 40 Cycles but we did an extra five just incase - you can stop it when the fluorescence levels off with “Stop Run” NOT ABORT, ABORT gets you no data!) - 95C for 10 sec - 60C for 1 mins
4) Check the Type of Dyes are being measured -3 Dye Hydrolosis and VIC and FAM should be selected (reporter Dyes that are used in the Probes we ordered)
5)Under Plate Set-Up Tab a) Label all the wells and put both reporter dyes in each well b) Labeled as Unknown Targets
6) Select “Relative Quantification” to tell machine what to look for
Results Went up with Janet the next day to export the data and from the fluorescent history and it looked like absolutely nothing amplified
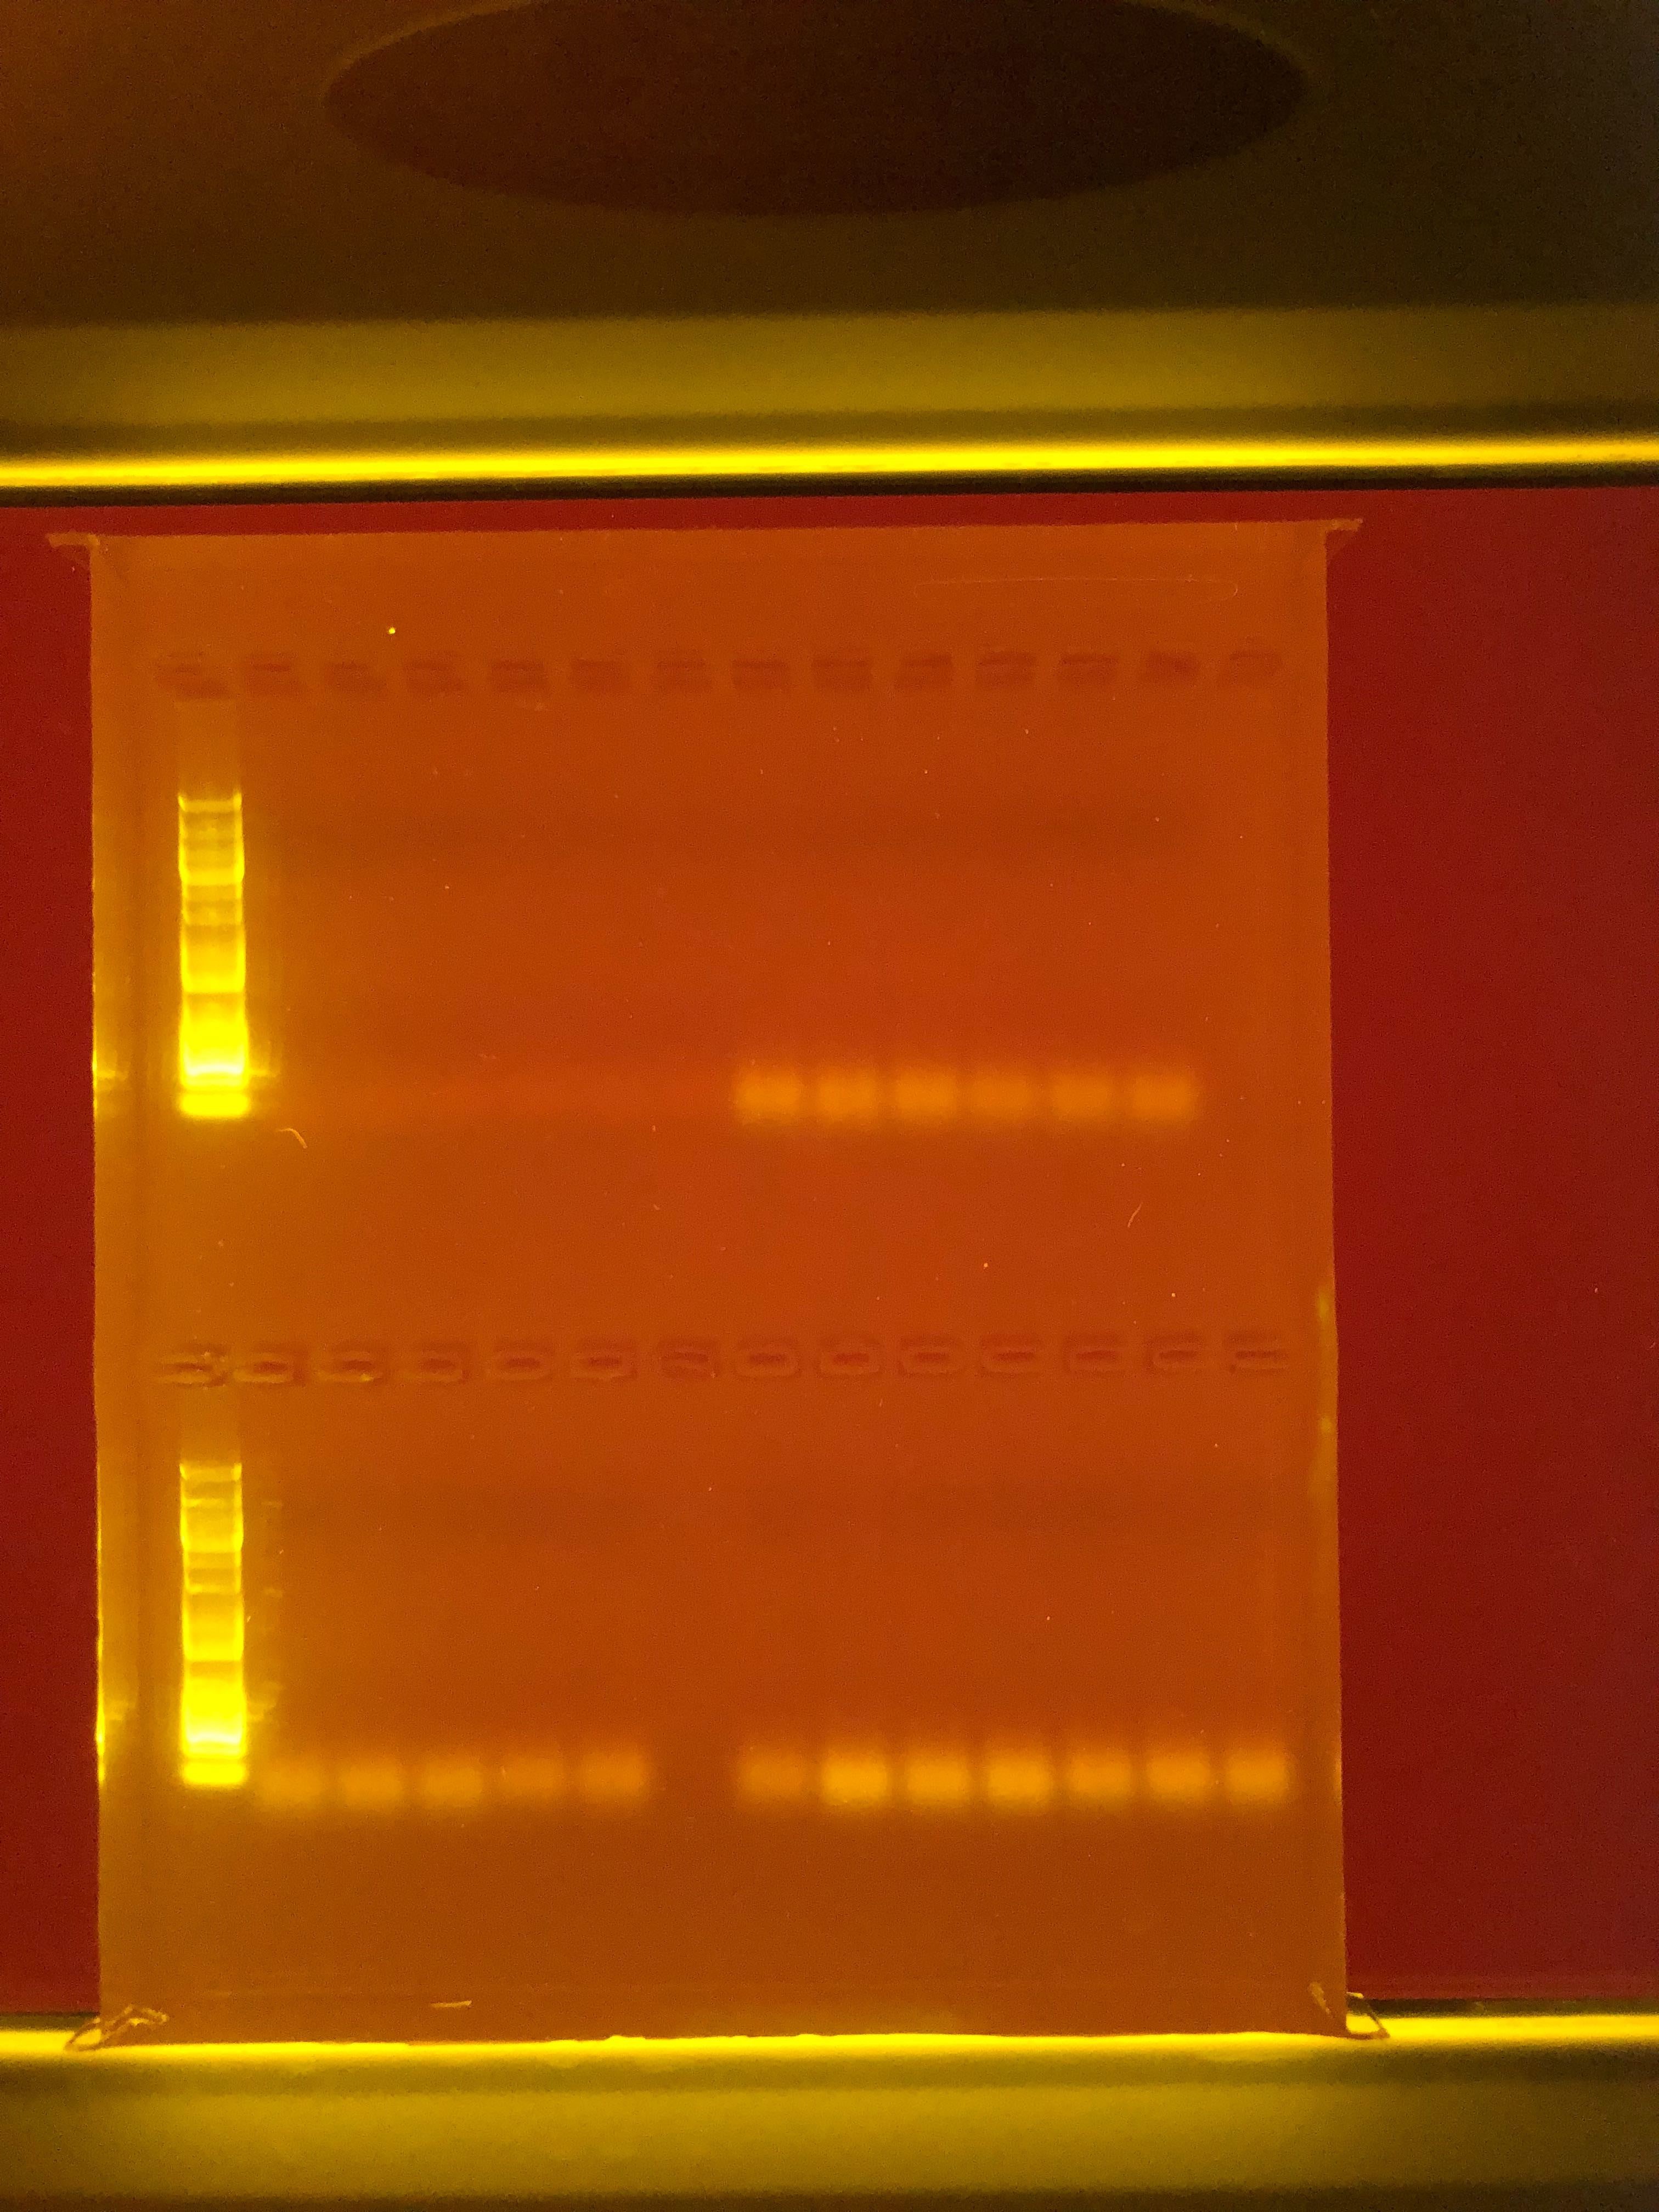
So ran a gel on the qPCR product from the qPCR run - Also did not get any bands (5uL of qPCR product with 1uL of Loading Dye on a 1% agarose gel run at 100V for 45mins - 100kb Ladder)
	Row 1: Ladder, A1-A12 (left to right)
	Row 2: Ladder, B1-B12 (left to right)

*20191009
In light of the lack of amplification I decided to run just a PCR to see if I could get any amplifications with just a regular PCR!
Samples Run Today: (All run in triplicate - 24 wells today used; A1-B12)
**Sample ID**
B1_t=0
B5_t=0
B6_t=0
O9_t=0
O11_t=0
O13_t=0
Each Well received (10uL reactions)
-TaqMan® Genotyping Master Mix		5uL
-SymC_For Primer (50nM)				1uL
-SymC_Rev Primer (75nM)				1uL
-SymD_For Primer (50nM)				1uL
-SymD_Rev Primer (75nM)				1uL (All primers, probes, and MM made into Mastermix - multiplied each by 6.2; additional 0.2 for pipette error)

-DNA								1uL
PCR Run:
a) Pre Incubation
		- 50C for 2 mins
		- 95C for 10 mins
b) PCR
	- 40 Cycles of
		- 95C for 10 sec
		- 60C for 1 mins
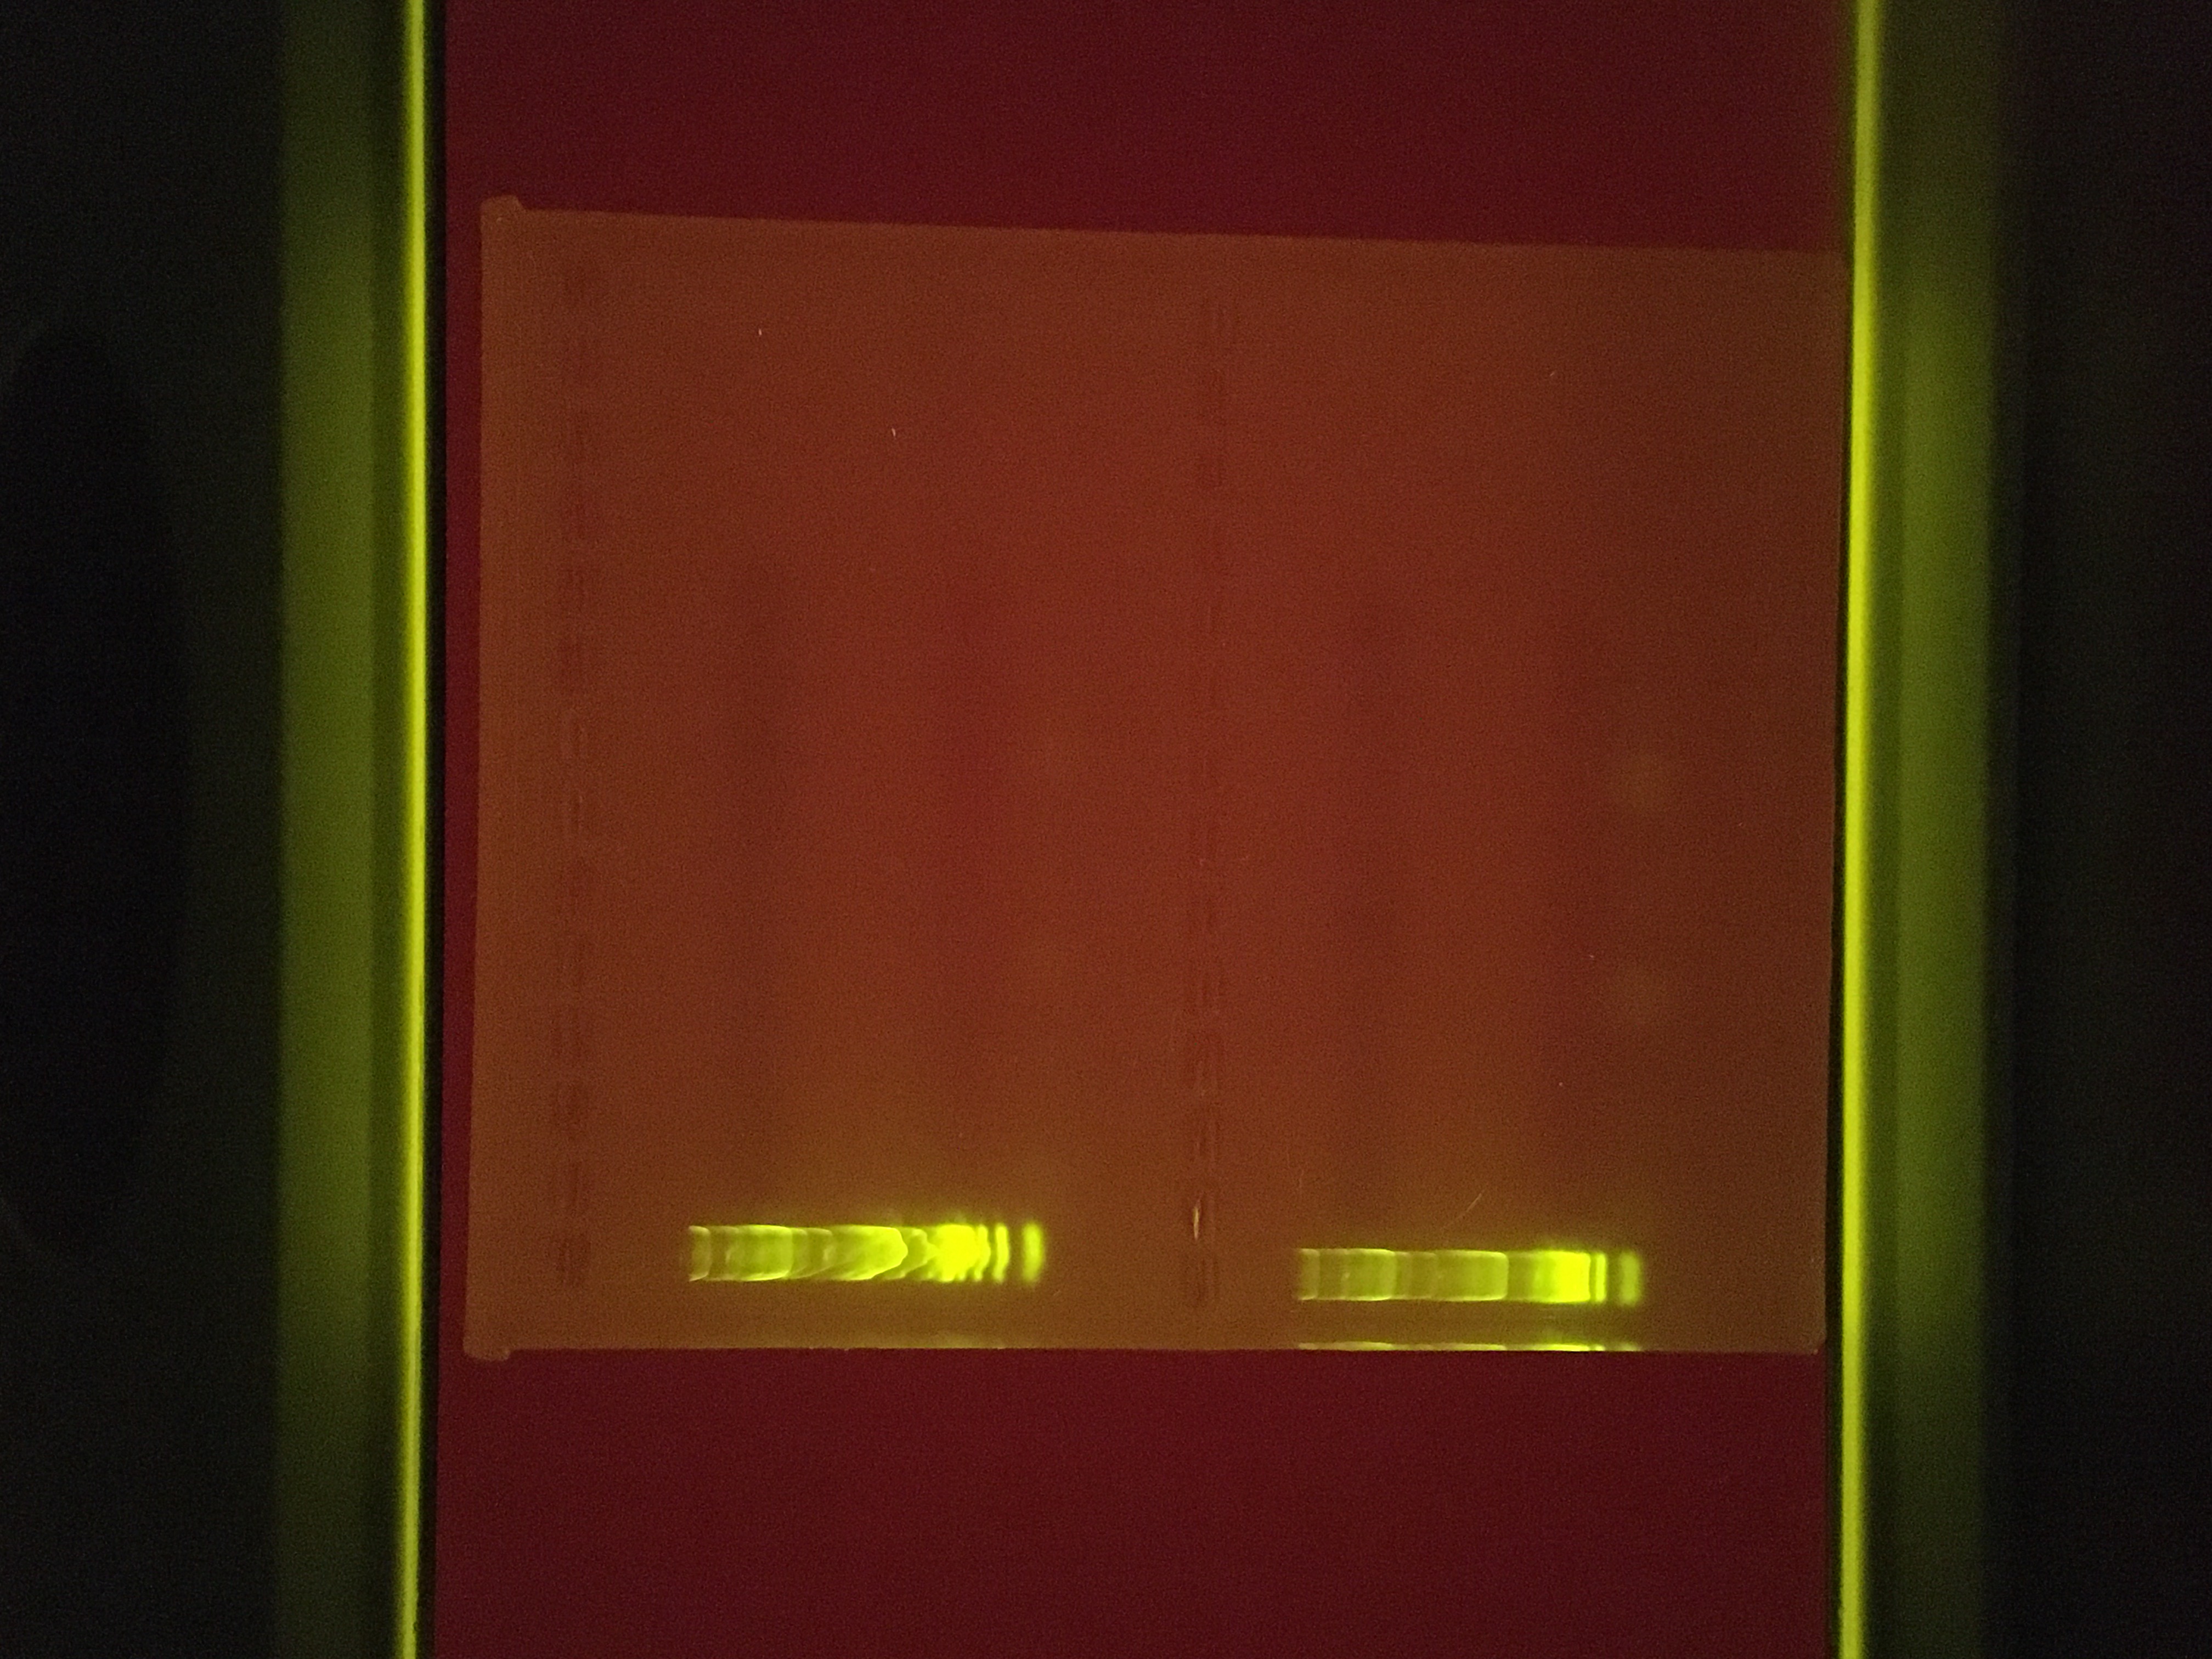
Once again no bands present in gel (5uL of qPCR product with 1uL of Loading Dye on a 1% agarose gel run at 100V for 45mins - 100kb Ladder)

*20191010
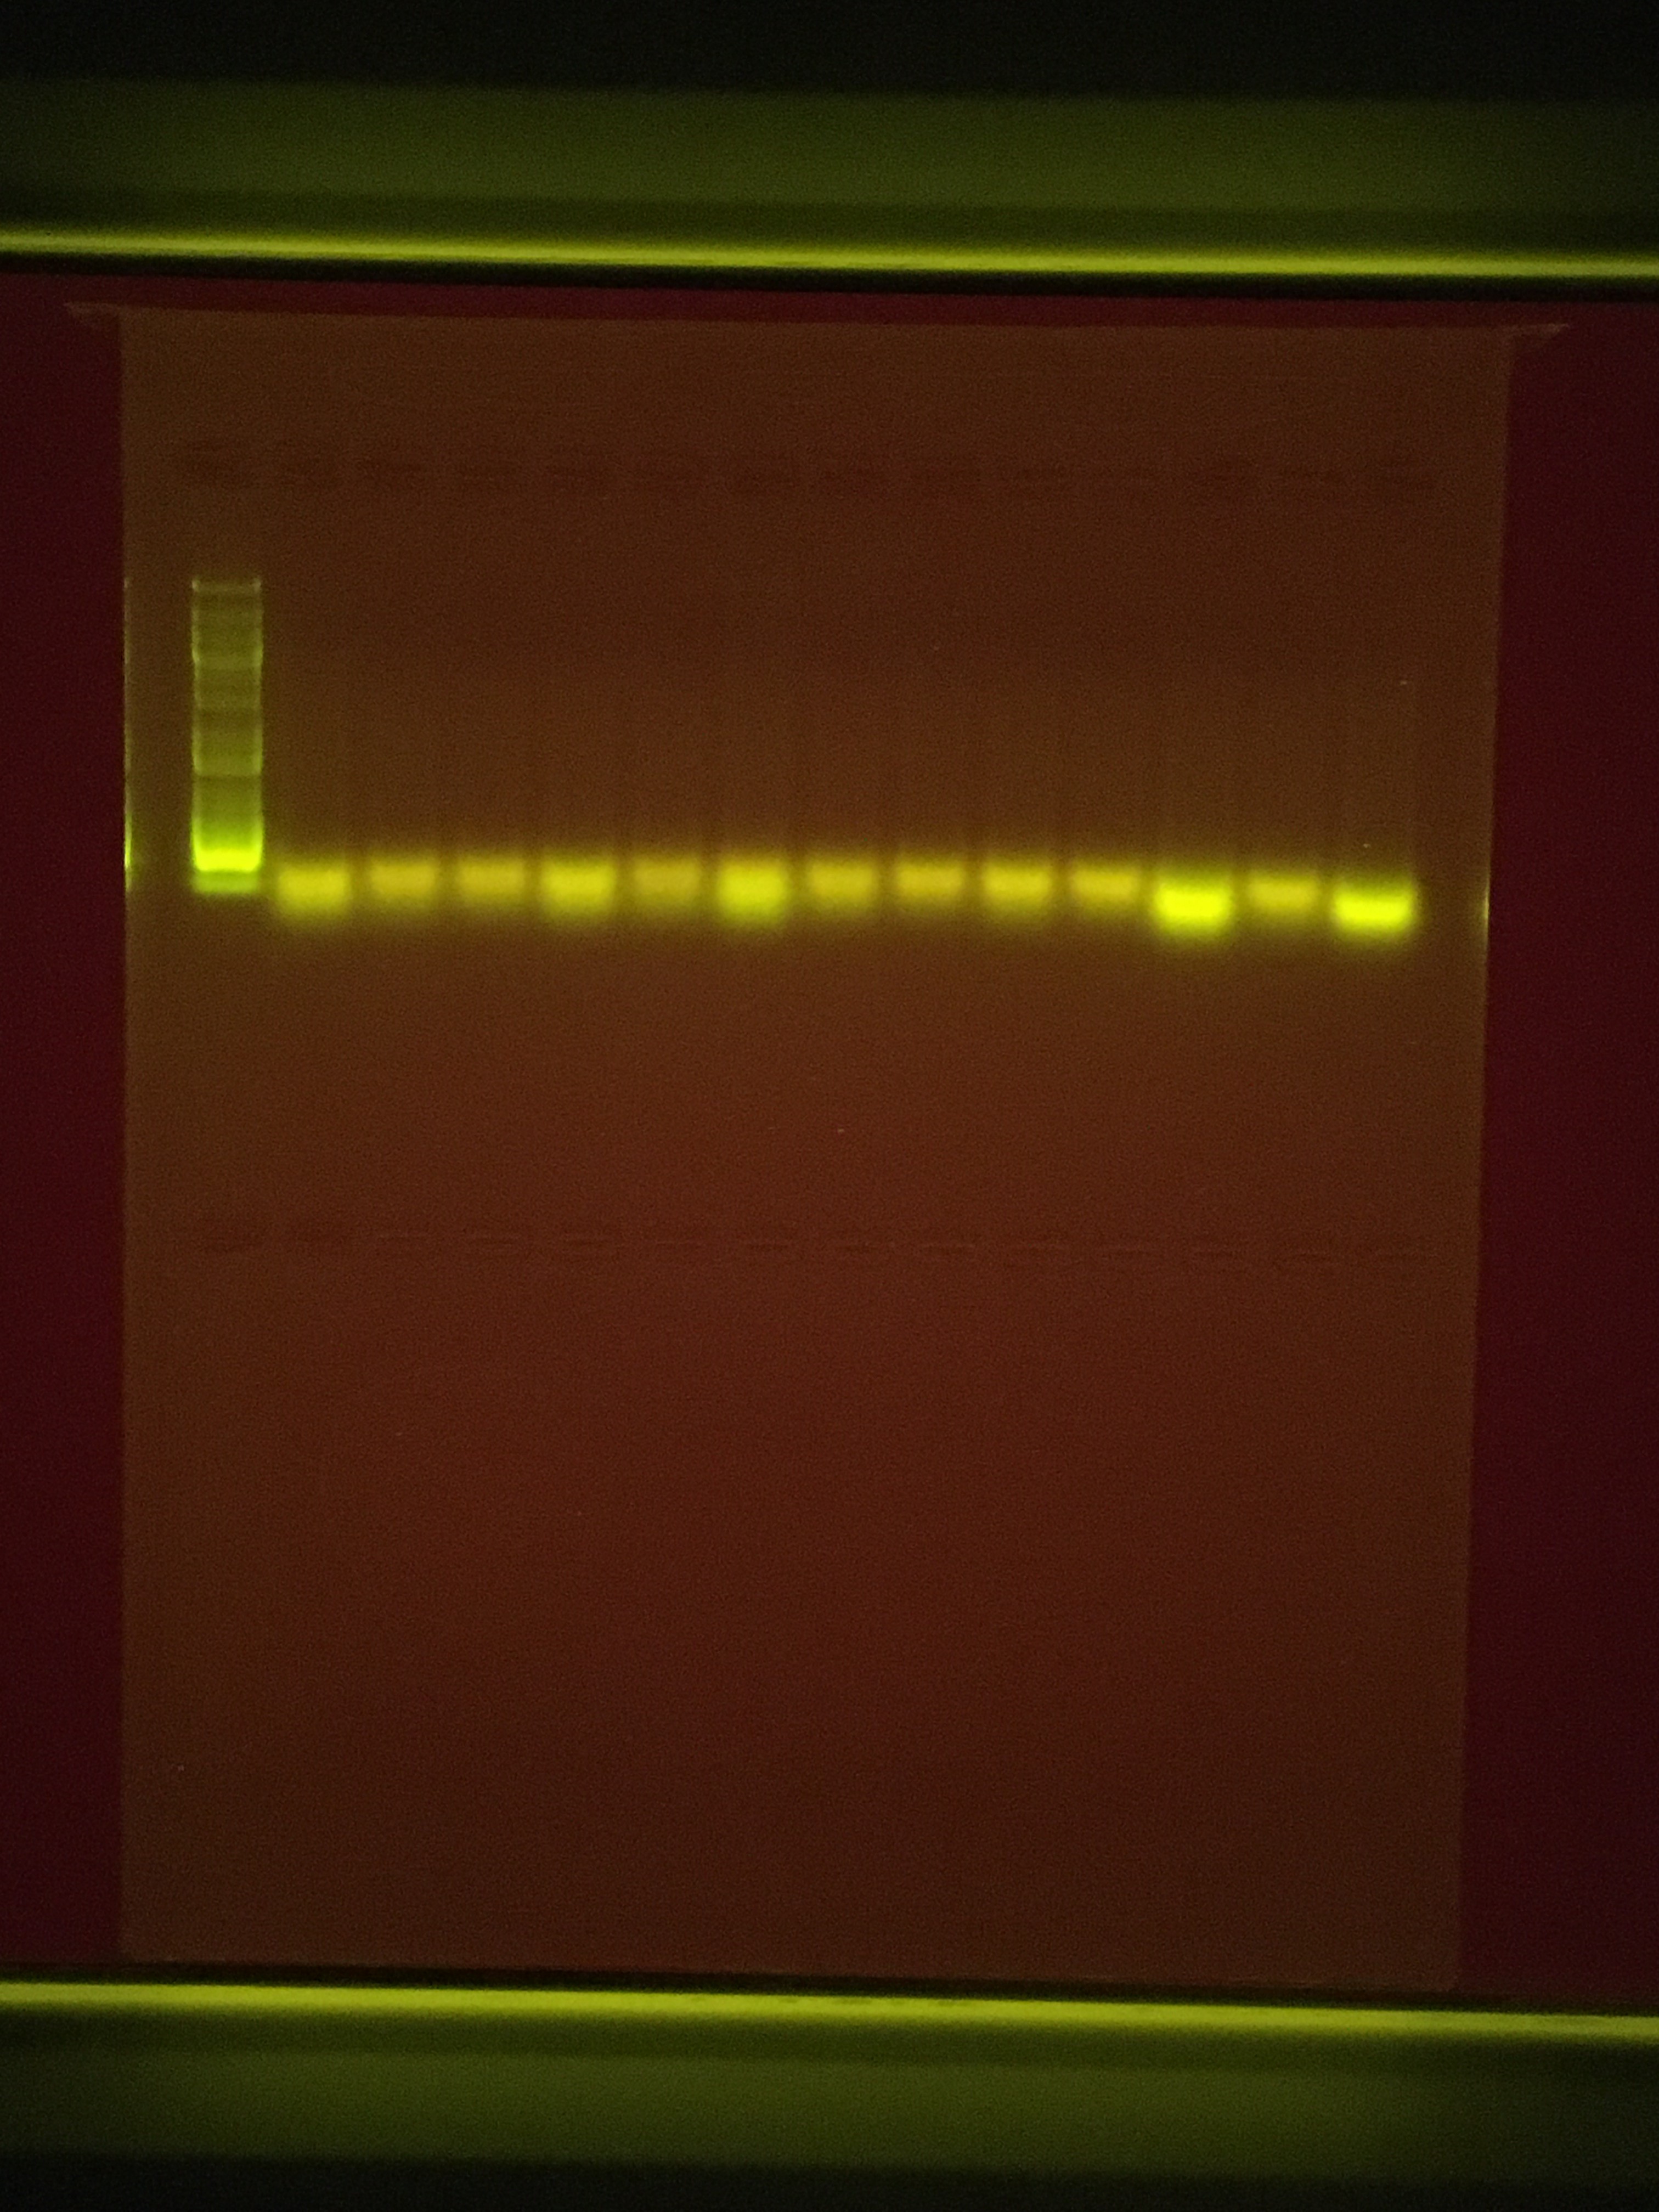
Since there was no clear amplification of the PCR today (20191010) I decided to run a gel on just the DNA I have extracted and this is what I got (5uL of qPCR product with 1uL of Loading Dye on a 1% agarose gel run at 100V for 45mins - 100kb Ladder)
Seems to be a serious gap in Nanodrop and Qubit and Gel quantifications of DNA present
Plan of attack
1) Requbit DNA again
2)Run PCR with actual PCR Mastermix not TaqMan® Genotyping Mix
	-Will run the six samples at three different dilutions (1:1, 1:10, 1:50) to see if can get anything to work
		Maybe too much DNA present?
*20191011
Today tried running a PCR with different dilution factors with the most concentrated DNA extracted samples (B1, B5, B6, O9, O11, and O13) for t=0 time point
Thought that this would help identify the problem with the lack of amplification
Dilution Factors were: 1:1, 1:10, and 1:50 for each samples
So in the gel they were well 2 was B1 (1:1), well 3 was B1 (1:10), well 4 was B1 (1:50), etc.
Each Well received (15uL reactions) - I do not remember why I decided on this volume
-TaqMan® Genotyping Master Mix		5uL
-SymC_For Primer (50nM)				2uL
-SymC_Rev Primer (75nM)				2uL
-SymD_For Primer (50nM)				2uL
-SymD_Rev Primer (75nM)				2uL (All primers, probes, and MM made into Mastermix - multiplied each by 6.2; additional 0.2 for pipette error)

-DNA								1uL
PCR Run:
a) Pre Incubation
		- 50C for 2 mins
		- 95C for 10 mins
b) PCR
	- 40 Cycles of
		- 95C for 10 sec
		- 60C for 1 mins
Once again no bands present in gel (5uL of qPCR product with 1uL of Loading Dye on a 1% agarose gel run at 100V for 45mins - 100kb Ladder)
Also should note that when making the master mix I kept having to make more and more of it because something in my calculations was off. Basically this was a huge mess


