Mcap qPCR Summary To Date
qPCR of Master’s Thesis Mcap Color Morphs and Subsequent Troubleshooting
Resuspension Completed on 20191003
Goal here is to get qPCR assay working to get clade composition data at outset of experiment as well as capture the change overtime.
- To date I have run one test run on the qPCR machine and three subsequent PCRs to try to get any amplification with this assay [see Results here](https://github.com/dconetta/DAC_Putnam_Lab_Notebook/blob/master/_posts/2019-10-09-Mcap_qPCR_Test_Troubleshooting.md)
Primer Information
C_Act_For: 5′-CCAGGTGCGATGTCGATATTC- 3′
C_Act_Rev: 5′-TGGTCATTCGCTCACCAATG- 3′
D_Act_For: 5′-GGCATGGGGTAAGCACTTCTT- 3′
D_Act_Rev: 5′-GATCCTTGAACTAGCCTTGGAAAC- 3′
Probe Information
C_Act_TAQProbe: 6000pmol/uL - 5′-VIC-AGGATCTCTATGCCAACG-MGB’ 3′ ; ThermoFisher - Catalog #4316034
D_Act_TAQProbe: 6000pmol/uL - 5′-6FAM-CAAGAACGATACCGCC-MGB- 3′ ; ThermoFisher - Catalog #4316034
MasterMix Information
TaqMan® Genotyping Master Mix ; ThermoFisher - Catalog #4371355
IDTDNA Resuspension Instructions
1)Centrifuge lyopholized primers for 2 mins at 12,000 RCF
2) Add TE Buffer (modulated pH unlike H2O)
	- Recommended to be no less than 1uM and no greater than 10mM
	- Standard is 100uM

	ORIGINAL SUSPENSION
		-25nmol ordered = 250uL of TE gets you to 100uM
			- Used Low TE -> 0.1mM EDTA vs 1 mM of EDTA in stock TE Buffer
			*I now know that these concentrations of primers are not going to be right since the stock was slightly higher than 100uM and each primer required specific amounts of TE buffer.*

	#New primers have been ordered as of 20191125 and will be resuspended the correct way.
Previous Attempts Primer Concentrations: Cunning et al. 2013 Methods referenced in Innis et al. 2018 paper
-
50nM Forward Primers (Both C and D)
- 999.5uL of Ultra Pure H2O
- 0.5uL of 100uM Forward Primers
-
75nM of Reverse Primers (Both C and D)
- 999.25uL of Ultra Pure H2O
- 0.75uL of 100uM Reverse Primers
Today’s Attempt Primer Concentrations: Updated methods sent from Teegan Innis (November 2019)
-
1uM Forward Primers (Both C and D)
- 999uL of Ultra Pure H2O
- 1uL of 100uM Forward Primers
-
1.5nM of Reverse Primers (Both C and D)
- 998.5uL of Ultra Pure H2O
- 1.5uL of 100uM Reverse Primers
Summary Table of Nanodrop DNA Results from Hawaii after re-extractions (July 2019)
| Sample Date | Date of Re-extraction | Sample Id | Timepoint | Concentration(ng/uL) | 260/280 | 260/230 |
|---|---|---|---|---|---|---|
| 6/9/2017 | 6/21/2019 | B1 | 0 | 140.4 | 2.03 | 1.43 |
| 6/9/2017 | 6/21/2019 | B2 | 0 | 80.6 | 2.05 | 1.31 |
| 6/9/2017 | 6/21/2019 | B3 | 0 | 73 | 2.09 | 1.21 |
| 6/9/2017 | 6/21/2019 | B4 | 0 | 63.9 | 2.08 | 1.08 |
| 6/9/2017 | 6/21/2019 | B5 | 0 | 77.1 | 2.09 | 1.34 |
| 6/9/2017 | 6/21/2019 | B6 | 0 | 103.1 | 2.05 | 1.3 |
| 6/9/2017 | 6/21/2019 | O7 | 0 | 75.1 | 2.05 | 1.14 |
| 6/9/2017 | 6/21/2019 | O8 | 0 | 80.5 | 2 | 1.15 |
| 6/9/2017 | 6/21/2019 | O9 | 0 | 71.4 | 1.95 | 1.03 |
| 6/9/2017 | 6/21/2019 | O10 | 0 | 54.1 | 2.05 | 1 |
| 6/9/2017 | 6/21/2019 | O11 | 0 | 117.3 | 2 | 1.33 |
| 6/9/2017 | 6/21/2019 | O12 | 0 | 90.1 | 2.05 | 1.25 |
| 6/9/2017 | 6/21/2019 | O13 | 0 | 73.8 | 1.95 | 1.1 |
Summary Table of BR DNA Qubit Results - Completed on 20191003
| Sample Id | Sample Type | Concentration 1 (ng/uL) | Concentration 2 (ng/uL) | Avg Concentration (ng/uL) |
|---|---|---|---|---|
| Standard1 | Standard | 165.99 | NA | NA |
| Standard2 | Standard | 23,383.96 | NA | NA |
| B1_t=0 | Brown Color Morph | 6.14 | 6.00 | 6.07 |
| B2_t=0 | Brown Color Morph | Too_Low | Too_Low | Too_Low |
| B3_t=0 | Brown Color Morph | Too_Low | Too_Low | Too_Low |
| B4_t=0 | Brown Color Morph | 3.54 | 3.50 | 3.52 |
| B5_t=0 | Brown Color Morph | 3.54 | 3.50 | 3.52 |
| B6_t=0 | Brown Color Morph | 4.90 | 4.84 | 4.87 |
| O7_t=0 | Orange Color Morph | Too_Low | Too_Low | Too_Low |
| O8_t=0 | Orange Color Morph | 2.30 | 2.26 | 2.28 |
| O9_t=0 | Orange Color Morph | 3.32 | 3.24 | 3.28 |
| O10_t=0 | Orange Color Morph | 2.06 | 2.04 | 2.05 |
| O11_t=0 | Orange Color Morph | 10.8 | 10.6 | 10.7 |
| O12_t=0 | Orange Color Morph | 2.86 | 2.82 | 2.84 |
| O13_t=0 | Orange Color Morph | 14.9 | 14.7 | 14.8 |
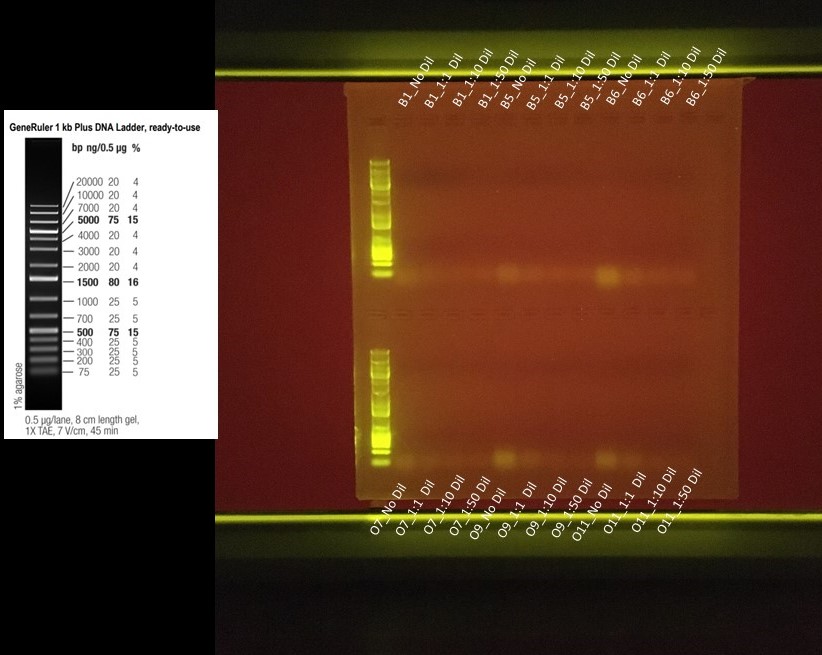
On 20191118 tried running a PCR with different dilution factors with the most concentrated DNA extracted samples (B1, B5, B6, O9, O11, and O13) for t=0 time point as well as trying to establish a positive control by testing this assay with freshly extracted MCAP samples that have successfully amplified for ITS_2 amplicon sequencing.
Thought that this would help identify the problem with the lack of amplification
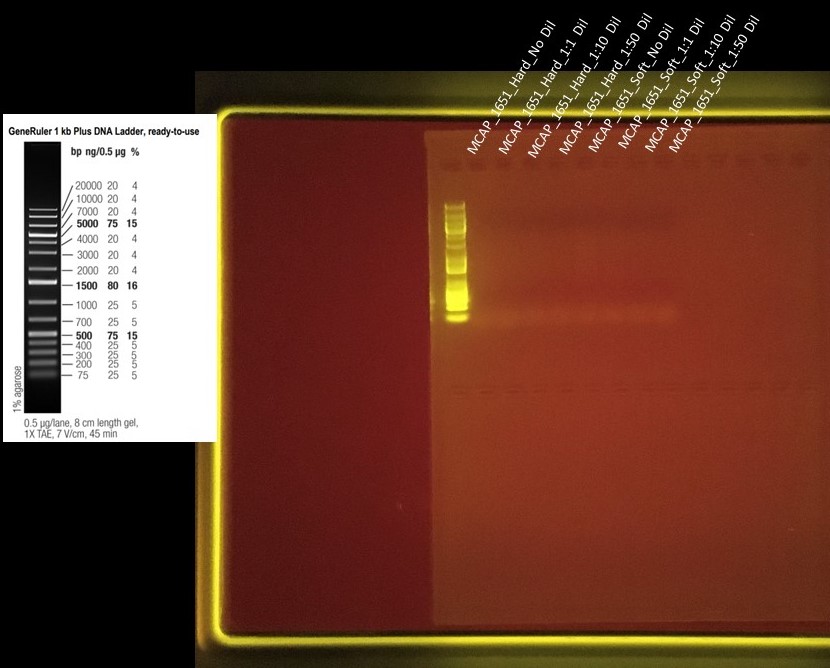
Freshly extracted DNA came from Emma’s Hawaii Bleaching Samples - MCAP colony 1651 hard and soft extractions (460 and 459 respectively for extraction ID’s) MCAP_1651_DNA_Info
Dilution Factors were: No Dilution, 1:1, 1:10, and 1:50
- Where
	- No dilution was just the required 1uL taken straight from the extracted DNA
	- 1:1 consisted of 2uL of DNA sample and 2uL of Molecular Grade Water
	- 1:10 consisted of 1uL of DNA Sample and 9uL of Molecular Grade Water
	- 1:50 consisted of 1uL of DNA Sample and 49uL of Molecular Grade Water
MasterMix for PCR
| Component | Concentration | Volume (uL) | Multiplier (# of Samples Run + 0.2 for error) | Total Vol Needed (uL) |
|---|---|---|---|---|
| Water | NA | 1 uL | 24.2 | 24.2 uL |
| C_Act_For | 1uM | 0.5 uL | 24.2 | 12.1 uL |
| C_Act_Rev | 1.5uM | 0.5 uL | 24.2 | 12.1 uL |
| D_Act_For | 1uM | 0.5 uL | 24.2 | 12.1 uL |
| D_Act_Rev | 1.5uM | 0.5 uL | 24.2 | 12.1 uL |
| TaqMan Genotyping MM | NA | 10 uL | 24.2 | 242 uL |
9uL of PCR Mastermix pipetted into each well along with 1uL of DNA for each sample at each dilution
PCR Run:
a) Pre Incubation
		- 50C for 2 mins
		- 95C for 10 mins
b) PCR
	- 40 Cycles of
		- 95C for 10 sec
		- 60C for 1 mins
		- 4C Hold
Gels: 1% Agarose Gel (.75g Agarose in 75mL of 1X TAE) Run at 100V for 60 minutes
Gel Run on 20191118 = All my samples

Gel Run on 20191119 = Positive Controls (ITS_2 Amplicon Samples)

